It's a log eat log world!
Let's discuss logging - unstructured, structured and canonical log lines - what they are and what value they bring to your production systems.

Following up on last week, I introduced the application we’ll work on: a mini-version of Substack.
This week, we start with logging. We discuss different kinds of logging, their benefits, and options for improving your log storage and retrieval.
Next, we design a logging architecture to transform our logs into actionable insights.
Outline
Introduction
Importance of logs in modern systems
What are structured logs?
What are canonical logs?
Challenges with log management
Inefficient storage
Standardisation
Security
Irrelevant information
Architecture for the demo app.
Log structure
Building a simple log data system with Clickhouse
Schema design
Asking meaningful questions
Conclusion
Importance of logging in modern systems
Today's systems are more complex than ever. What used to be a single application running on a server is now multiple services communicating with each other over a network/s.
This can lead to system failures of all kinds, which can happen at any point. Knowing what happened during a request's lifecycle can help debug system failures and potential customer issues.
One way of understanding the lifecycle of a request is using logging. Emitting log events whenever something happens, storing them in a log store, and reaching for them in an on-call situation.
If your logs are well-structured, making correlations during incidents becomes considerably easier.
Unstructured logs
Let’s start with an example. You have an application that does some incredibly exciting stuff. You’ve built this really quickly because you want some customers onboard.
One day, your system goes down. You don’t know what happened, so you make assumptions and print something to standard output.

Then, you spend hours searching for the issue, which you eventually discover.
To simplify things for yourself, you implement unstructured logs—something that resembles this—and store it in a log file:

An inconsistent log format characterizes unstructured logs. If you look at the example for unstructured logs above, you’ll see that there isn’t consistency with the way the logs are structured. And even though they have a timestamp placed on them, in some cases, you might find that some log events don’t even have a timestamp.
This format has a number of problems.
This can make it difficult to search and filter. You must use grep and awk to find what you’re looking for; it is not machine-readable.
Another issue is that, depending on how you store it, it can become expensive over time and may not be as beneficial for debugging.
On a tangent, here’s an example of logging that caused Kubernetes pods not to be scheduled:

This post discusses solving problems with unstructured logs using structured and canonical logs.
What are structured logs?
Structured logs are logs with a consistent format. Often outputting in formats like JSON or logfmt. They are designed to be machine-readable, which means they can be easily processed by log aggregators like Loki or ElasticSearch and follow a key-value pair structure.
This means parsing and analysing these logs becomes much easier using keys.
Here’s an example using structlog:

Here, you can see that there is a structure. A timestamped record with a log level, an event message and some metadata relating to the event in key-value pairs. In this example, I’ve decided to go with logfmt, but this can also be rendered in JSON, and it looks like this:

These formats are easier to search. I can filter these logs by a specific key, such as user_id or request_id. This allows you to “dump” any metadata in your logs, which will eventually be useful for diagnosing issues.
What are canonical logs?
Canonical logs are synonymous with structured logs. The key difference lies in that with canonical logs; you emit a single log line at the end of a request containing all the necessary data you might need. In contrast, standard structured logs emit multiple log lines per request.
The idea is to provide as much context as possible regarding a request with each log event.
Brandur Leach defines it like this:
Literally, one big log line
The concept is simple: a canonical line is a big log line that gets emitted at the end of a request. It’s filled with fields for all of that request’s key information.
Essentially, you could use canonical logs as a single source of truth about the events in your system because you dump all the context you might need for future investigation within your logs.
Structured and canonical logs also make for great analysis using tools like Clickhouse or DuckDB.
Challenges with log management
Inefficient storage
One of the biggest challenges with log management is storage. The high volume of logs could become expensive because you emit multiple log lines per request over multiple handlers.
Of course, to handle this, you could implement retention policies to help improve the storage problem. For example, your system may only need seven days’ worth of logs for investigation, while other systems might need 90 days’ worth.
Another option is sampling, which involves capturing only a subset of logs instead of everything.
Standardization
Another challenge is standardizing the format of your logs. Every team might have its own way of formatting logs. Some might prefer logfmt, while others prefer JSON.
It’s important to follow a standardized format across your systems so that there’s a unified language.
Security
Another challenge is what kind of data to throw into the logs. It can happen that you dump sensitive data like personal user information like addresses, IDs, or passwords. Depending on your security posture, make sure you continue auditing for sensitive data in your logs.
Irrelevant information
One last challenge in managing logs is irrelevant information like verbose debug logs, logs with no context or repetitive messaging.
This can happen when logging events from the same handler multiple times.
Now, let’s move on to our demo app.
The architecture
Now that we understand logging, I’ll describe a simple architecture for our app.

Vector is a tool for building observability pipelines between our app and the log stores.
Vector collects our app logs and routes them to Loki, our log aggregator, and Clickhouse.
We want to be able to slice and dice our log data to ask meaningful questions about our system, so we send our events to Clickhouse as well and create visualisations with Grafana.
Another thing I do here is sample. Since I’m allowing Locust to spawn 5,000 users, I don’t want to end up with hundreds of thousands of logs, so I sample one out of 50 log events to keep things tidy.
Also, I fought long and hard to get Vector to work correctly with Loki and Clickhouse. If you want to see the pain, you can look at this PR to understand it. Figuring out the details was fun.
Much of my implementation is a combination of the ideas in these posts:
The log structure
I’ve decided to use this structure for naming events: “resource.operation.status”. For example, “user.search.started” means the search for a user has begun. This helps me make a mental model of the type of operation that was happening in the system.
The opposite of this would be “user.search.failed”, meaning the search for a user failed.
I also add as much context about the event as possible, such as the request ID, hostname, user agent, database timings, user ID, framework version, language version, etc.
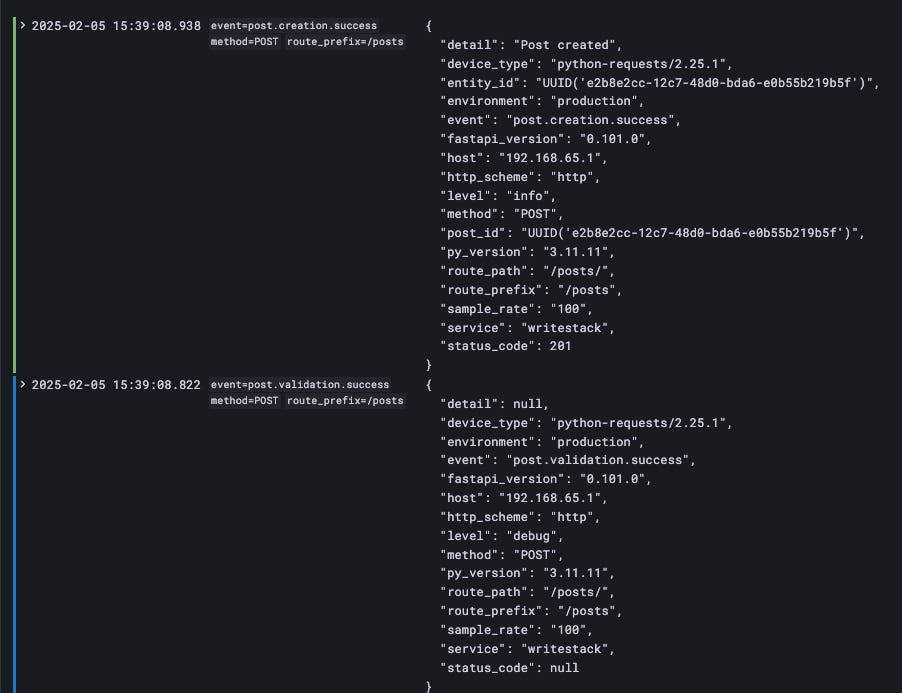
After running Locust, we get this result in Loki: the timestamp is on the far left, the unique labels are in the middle, and the structured logs are on the right.
Using the log structure we spoke about, looking at the above example, we can reason that our system successfully validated post data by looking at the “post.validation.success” event and then, right after the creation of the post, was successful.
This idea is to help an on-call engineer or anyone who is curious to understand what is happening. Of course, you don’t have to follow this structure but consider how you want to structure your logs to help anyone who is new to your log system.
Designing a log system using Clickhouse
Part of the motivation comes from reading about Scuba and similar systems that enable users to navigate through data and ask questions about their systems. To achieve a similar capability, we can store our logs in Clickhouse.
So, to ensure that I design a sensible schema, I’ll use some of the information in the OTel Log Data Model as a starting point.
My schema design looks like this:
CREATE TABLE application_logs (
	event String,
	log_level String,
	message String,
	timestamp DateTime
) ENGINE = MergeTree()
ORDER BY timestamp;
Originally, the schema mapped one-to-one to the fields in the logs. However, when I added new log fields, I had to create a new field in the table to accommodate them. That can be tedious.
This design, I think, is more flexible.
All the log messages are sent into the message field; if any changes are made, the table itself will not need to be changed.
Of course, this design is simple for our purposes but can be extended in whatever way your system requires. For example, if you needed to include information about traces.
Here’s the output of what the Clickhouse data looks like after generating a load on the app:

Asking meaningful questions
Ultimately, we want to be able to analyze our data and ask meaningful questions about our service. This will help us identify trends and subsequently build better services.
The one downside to this approach is that you need to have some idea of how to use SQL. Otherwise, it can be a drag.
So, let’s ask our first question.
What is the count of successful user searches per hour?
Here’s my SQL query for this question:
SELECT
    toStartOfHour(timestamp) AS hour,
    count(*) AS search_count
FROM logs.application_logs
WHERE event = 'user.search.success'
GROUP BY hour
ORDER BY hour;
Which results in:

Knowing at what periods of the day user searches happen can help us allocate resources during high-activity periods of the day/week/month.
Maybe we could ask the opposite.
What is the count of unsuccessful user searches per hour?
SELECT
    toStartOfHour(timestamp) AS hour,
    count(*) AS search_count
FROM logs.application_logs
WHERE event = 'user.search.failed'
GROUP BY hour
ORDER BY hour;
Our system generally has fewer user search failures, but this could still indicate something that needs fixing.
Perhaps we can have a look at which device type has the most user search failures.
What is the count of unsuccessful user searches per hour by device type?
SELECT
    JSONExtractString(message, 'device_type') AS device_type,
    count(*) AS search_count
FROM logs.application_logs
WHERE event = 'user.search.failed'
GROUP BY device_type
ORDER BY search_count DESC;
This question can help us segment these user search failures by which devices they are coming from. In our example, load is generated by Locust, which uses Python’s request library, so we only have one device type showing on our dashboard.
In your use case, this could be a broader slice of data that you can use to diagnose which platforms/devices might be the most problematic.
We could ask which users had the most repeated failures on search.
Which users are experiencing repeated failures?
SELECT
    JSONExtractString(message, 'user_id') AS user_id,
    count(*) AS failure_count
FROM logs.application_logs
WHERE event = 'user.search.failed'
GROUP BY user_id
HAVING failure_count > 3
ORDER BY failure_count DESC;
We can use this to reach out to the top N users who are most affected proactively. For example, your use case might be an e-commerce store, and you might want to know which users had the most order or payment failures.
This kind of data from your logs can bring great insight into what your users are experiencing.
Now, say we wanted to know how many newsletters are being created per hour.
What is the number of successfully created newsletters per hour?
SELECT
    toStartOfHour(timestamp) AS hour,
    count(*) AS action_count
FROM logs.application_logs
WHERE event = 'newsletter.creation.success'
GROUP BY hour
ORDER BY hour;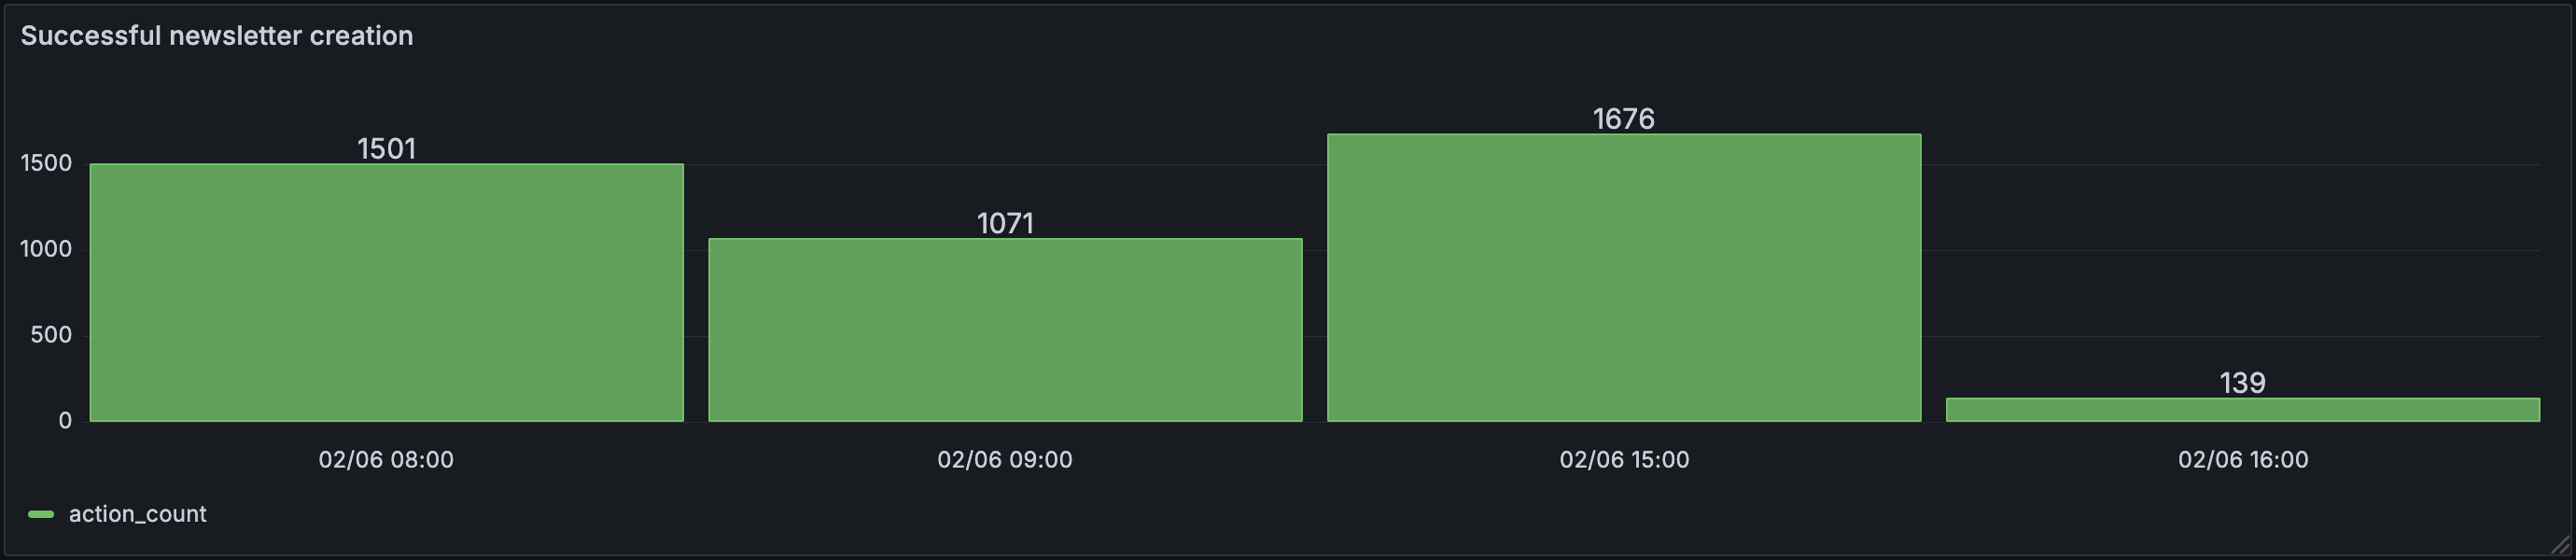
This can help us track how often users create newsletters and at what times this occurs.
We could even investigate further to determine which users create the most newsletters. We could ask questions about newsletter subscriptions and which types of subscriptions (free or paid) are most popular on our app.
Conclusion
This is by no means an exhaustive list of questions we can ask, but as you can see, using well-structured logs, we can easily debug issues in our systems when they arise.
We can become like the Business Intelligence teams and start interrogating our log data, taking proactive steps to resolve issues, and building better systems.
So, where do you start? You don’t have to design a system built on Clickhouse to gain insights into your data. You can start by structuring your logs.
Think about what kind of data you need and dump that context in your logs. If you’re worried about log volume being an issue, consider sampling and adjusting your retention periods.
If you get anything out of this post, it’s this: let’s build better, transparent systems.